Docs: Instrumentation & debugging
Instrumentation and debugging
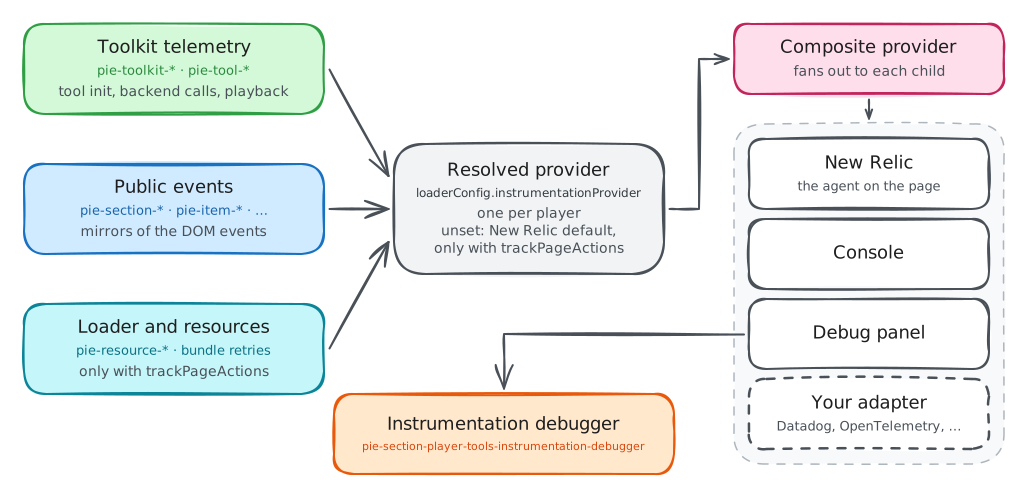
The players and toolkit report what they observe, such as load failures, retries, tool errors and lifecycle events, to an instrumentation provider you choose. PIE owns no backend: your page owns the agent, credentials, sampling and cost. Product analytics is outside this surface.
Providers
The contract
An InstrumentationProvider implements trackError, trackEvent, trackMetric, setUserContext and setGlobalAttributes, plus initialize, isReady and destroy. Extend BaseInstrumentationProvider to write an adapter for
any backend.
Shipped adapters
New Relic, console, debug panel and composite, which fans out to several. Adapters read the
vendor handle already on the page and import no vendor SDK; a provider sends only while isReady() is true, so events start flowing when the agent arrives. Datadog and
OpenTelemetry adapters are yours to write.
Provider resolution
Each player reads instrumentationProvider and trackPageActions from its loaderConfig: section players from runtime.player.loaderConfig, the item
player from its own loader-config, the toolkit from the item-player configuration it
is given. trackPageActions defaults to false, so nothing is sent unless
you opt in.
instrumentationProvider | Resolves to |
|---|---|
unset | The shared New Relic default when trackPageActions is true; otherwise none |
null | None, whatever trackPageActions says |
An object meeting the contract | That object |
Anything else | None, with a warning in debug mode; no fallback to the default |
What is reported
| Stream | Events | Notes |
|---|---|---|
| Toolkit telemetry | pie-toolkit-*, tool initialization, backend calls, library loads, operations and
playback | Tagged instrumentationLayer: "toolkit" with assessment, section and attempt ids.
Error events also go to trackError. |
| Public events | pie-toolkit-*, pie-section-*, pie-item-*, pie-assessment-* | Mirrors of the players' DOM events. Learner responses are not forwarded; item runtime errors
go to trackError. |
| Loader and resources | pie-resource-load, -retry, -load-error, bundle retries,
shared-dependency and MathJax version conflicts | Only with trackPageActions: true. |
Metrics are sent as events with a metric: prefix. Attribute names are not yet
centrally namespaced, and nothing is buffered before a provider is ready.
Debugger panels
Six published packages give a section player integration floating inspection panels. They are
development aids for your own test pages; keep them out of learner delivery. Every panel except the
instrumentation debugger reads the ToolkitCoordinator you set as its toolkitCoordinator property, and every panel dispatches close.
Event debugger
Live feed of item and section events: session changes, selection, content loads, completion, navigation and errors. Collapses repeats; pause and clear.
@pie-players/pie-section-player-tools-event-debuggerInstrumentation debugger
Every event, error, metric, user context and global attribute a DebugPanelInstrumentationProvider sees, as a provider would receive it.
@pie-players/pie-section-player-tools-instrumentation-debuggerPNP debugger
The tool policy decision for each tool, with diagnostics. Editable mode changes placement, provider settings, PNP supports and enforcement live.
@pie-players/pie-section-player-tools-pnp-debuggerSession debugger
The section session state the controller holds and persists.
@pie-players/pie-section-player-tools-session-debuggerTTS settings
Pick and preview a read-aloud provider and voice (browser, Polly, Google or your own tabs) and apply it to the running toolkit.
@pie-players/pie-section-player-tools-tts-settingsShared panel chrome
The floating panel the others use: drag, resize, minimize, and a layout remembered per persistence-scope.
@pie-players/pie-section-player-tools-sharedThe instrumentation debugger shows only what reaches a DebugPanelInstrumentationProvider,
so run one beside your production provider in a composite, as above. Set persistence-scope to keep each panel's position and size across reloads.
Reference
Instrumentation providers design(opens in new tab) · Section player instrumentation(opens in new tab) · players-shared README(opens in new tab)